Notices by Giorgio Comai (giocomai) tagged dataviz
-
Giorgio Comai (giocomai)'s status on Friday, 09-Nov-2018 15:55:16 CET  Giorgio Comai
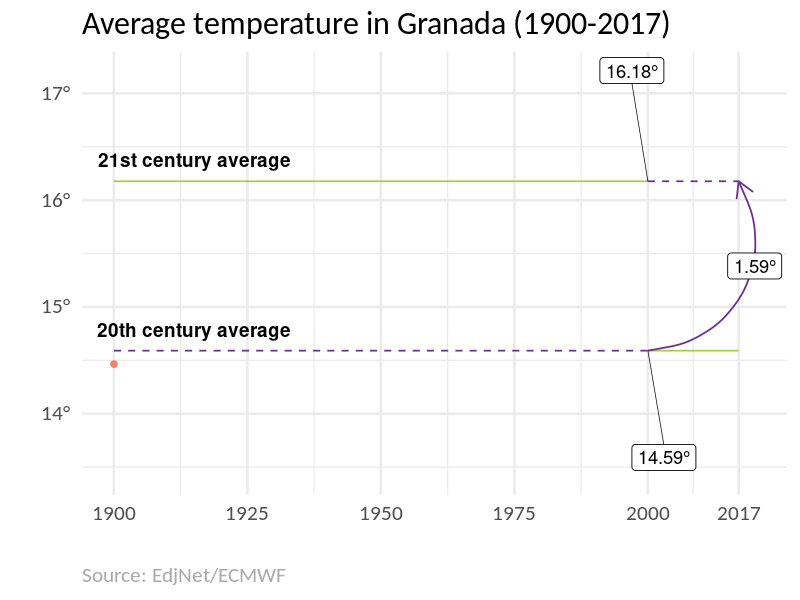
Animating time series with gganimate and ggplot - I put up some examples with code based on EDJnet's data on temperatures in European cities between 1900 and 2017. #rstats #dataviz https://medium.com/european-data-journalism-network/animating-one-degree-warmer-time-series-with-ggplot2-and-gganimate-7460862fcd7e https://social.giorgiocomai.eu/attachment/34865 -
Giorgio Comai (giocomai)'s status on Tuesday, 10-Apr-2018 11:06:43 CEST
Giorgio Comai
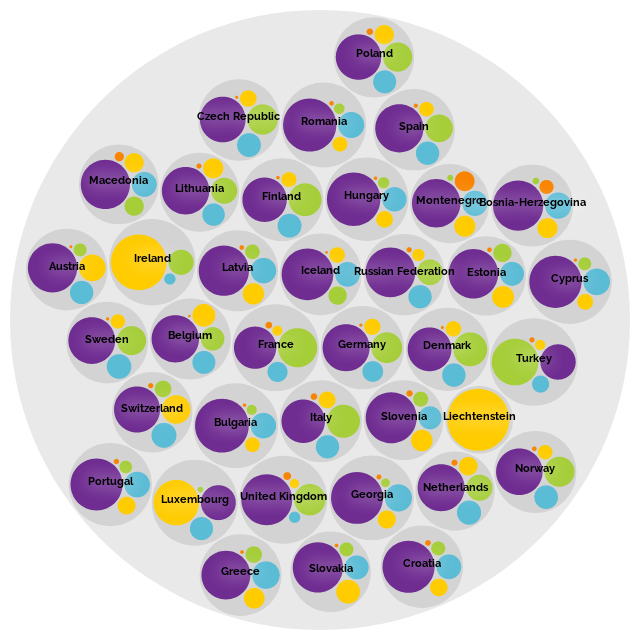
After scraping 40.000+pages of a website with a distinct 1990s look, here's my #dataviz "interactive exploration of cinema-goers' habits in Europe based on twenty years of data (1996-2016) on 40996 films."
https://www.europeandatajournalism.eu/eng/News/Data-news/Europeans-at-the-cinema
Best viewed full screen: https://datavis.europeandatajournalism.eu/obct/giocomai/2018-04-EuropeanCinema/
#rstats -
Giorgio Comai (giocomai)'s status on Tuesday, 27-Mar-2018 21:11:34 CEST
Giorgio Comai
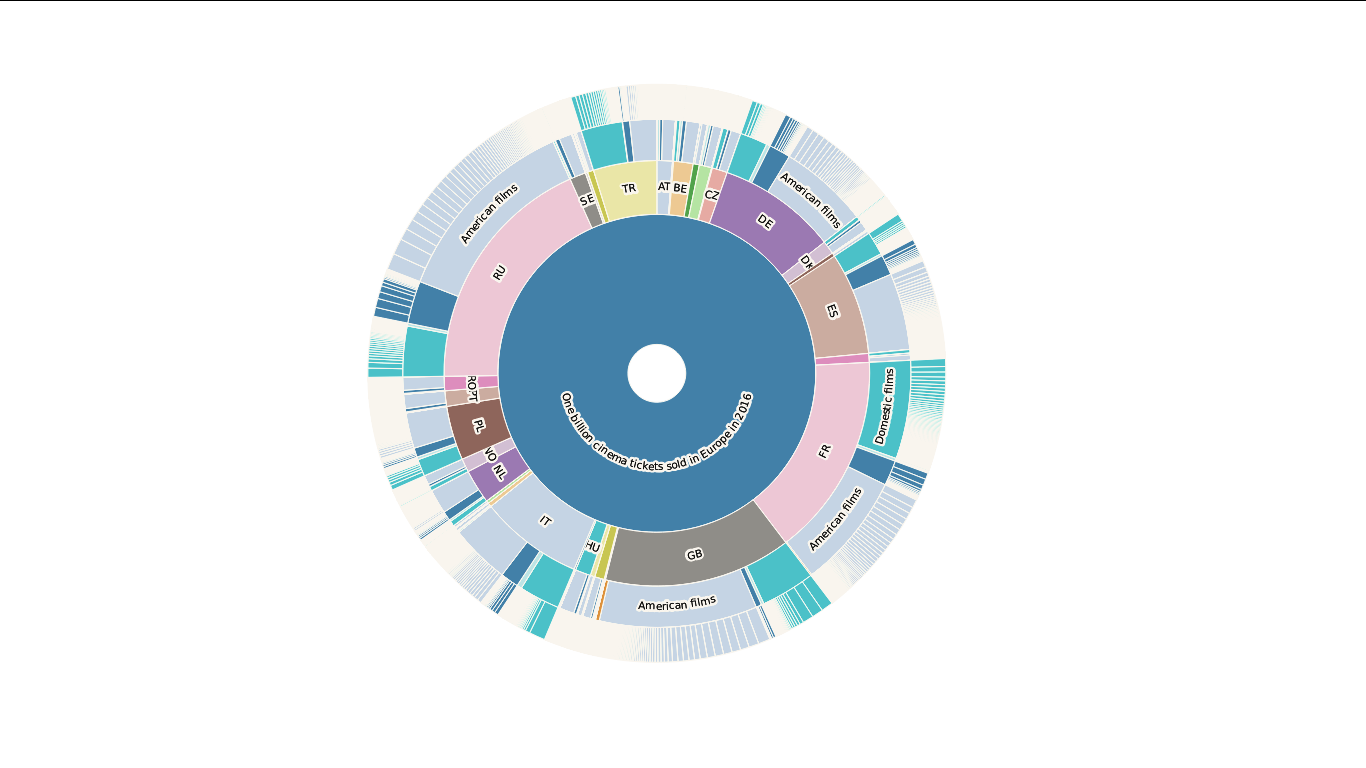
For the records, I'll most probably end up leaving out the zoomable sunburst (not intuitive enough for too many people, and pretty bad in conveying data), and instead opt for an adjusted zoomable circle packing. It ultimately gives a glimpse of the data, allows to explore individual cases, and serves its purpose of introducing some change in a product filled with barcharts https://giorgiocomai.eu/testzone/cinema/ZoomableCircle/index.html #dataviz #d3js https://social.giorgiocomai.eu/attachment/23966 -
Giorgio Comai (giocomai)'s status on Saturday, 24-Mar-2018 15:36:22 CET
Giorgio Comai
Here's how the zoomable sunburst looks:
#dataviz https://social.giorgiocomai.eu/attachment/23707 -
Giorgio Comai (giocomai)'s status on Saturday, 24-Mar-2018 15:33:59 CET
Giorgio Comai
- collapsible barchart (click on bar to zoom in, click on white space next to bar to zoom out): https://giorgiocomai.eu/testzone/cinema/barchart/
Not so funky, but much clearer and easier to explore (perhaps speeding up transitions, and slightly increasing font size)
Other suggestions?
#d3js #dataviz -
Giorgio Comai (giocomai)'s status on Saturday, 24-Mar-2018 15:33:33 CET
Giorgio Comai
Work in progress: what's the most effective way to show *all* cinema tickets sold across Europe:
[based on actual data for 2016]
- zoomable sunburst (click on slice to zoom in, click on centre to zoom out): https://giorgiocomai.eu/testzone/cinema/zoomLabels/
Funky, but not so clear, and slow on some hardware
#d3js #dataviz -
Giorgio Comai (giocomai)'s status on Thursday, 08-Mar-2018 19:10:16 CET
Giorgio Comai
Joining the #dataviz #ddj debate on electoral maps about #ItalyElection2018 results.
Criticism: the most common map with electoral results (North=blue, South=yellow) has led to misleading analyses (country=divided).
Here's my quick reply #rstats https://social.giorgiocomai.eu/attachment/22500 -
Giorgio Comai (giocomai)'s status on Sunday, 21-Jan-2018 13:59:47 CET
Giorgio Comai
I'm looking for an effective way to highlight how much the RUB/USD exchange rate has changed over recent years. I think classic line graph doesn't really convey it, so I tried with a barchart adding lines for the percentage change. Suggestions from the fediverse?
#rstats #dataviz #ggplot2 https://social.giorgiocomai.eu/attachment/19361 -
Giorgio Comai (giocomai)'s status on Wednesday, 01-Nov-2017 11:23:05 CET
Giorgio Comai
"Crisis? What Crisis?" My exploration of ~55,000 press releases issued by the European Commission since 1985 is now online: https://www.europeandatajournalism.eu/eng/News/Data-news/Crisis-What-crisis
Historians may end up remembering the period 2008-2017 as the "decade of the crisis". But as of 2017, all types of crisis seem to be disappearing.
Interactive #dataviz available at the link above.
#rstats source code here: https://github.com/giocomai/codebase-blog/blob/master/content/post/2017-10-04-crisis-what-crisis.Rmd https://social.giorgiocomai.eu/attachment/11437
